OpenSearch Dashboard
Here is how you monitor the Mata Elang v2 system using OpenSearch Dashboard.
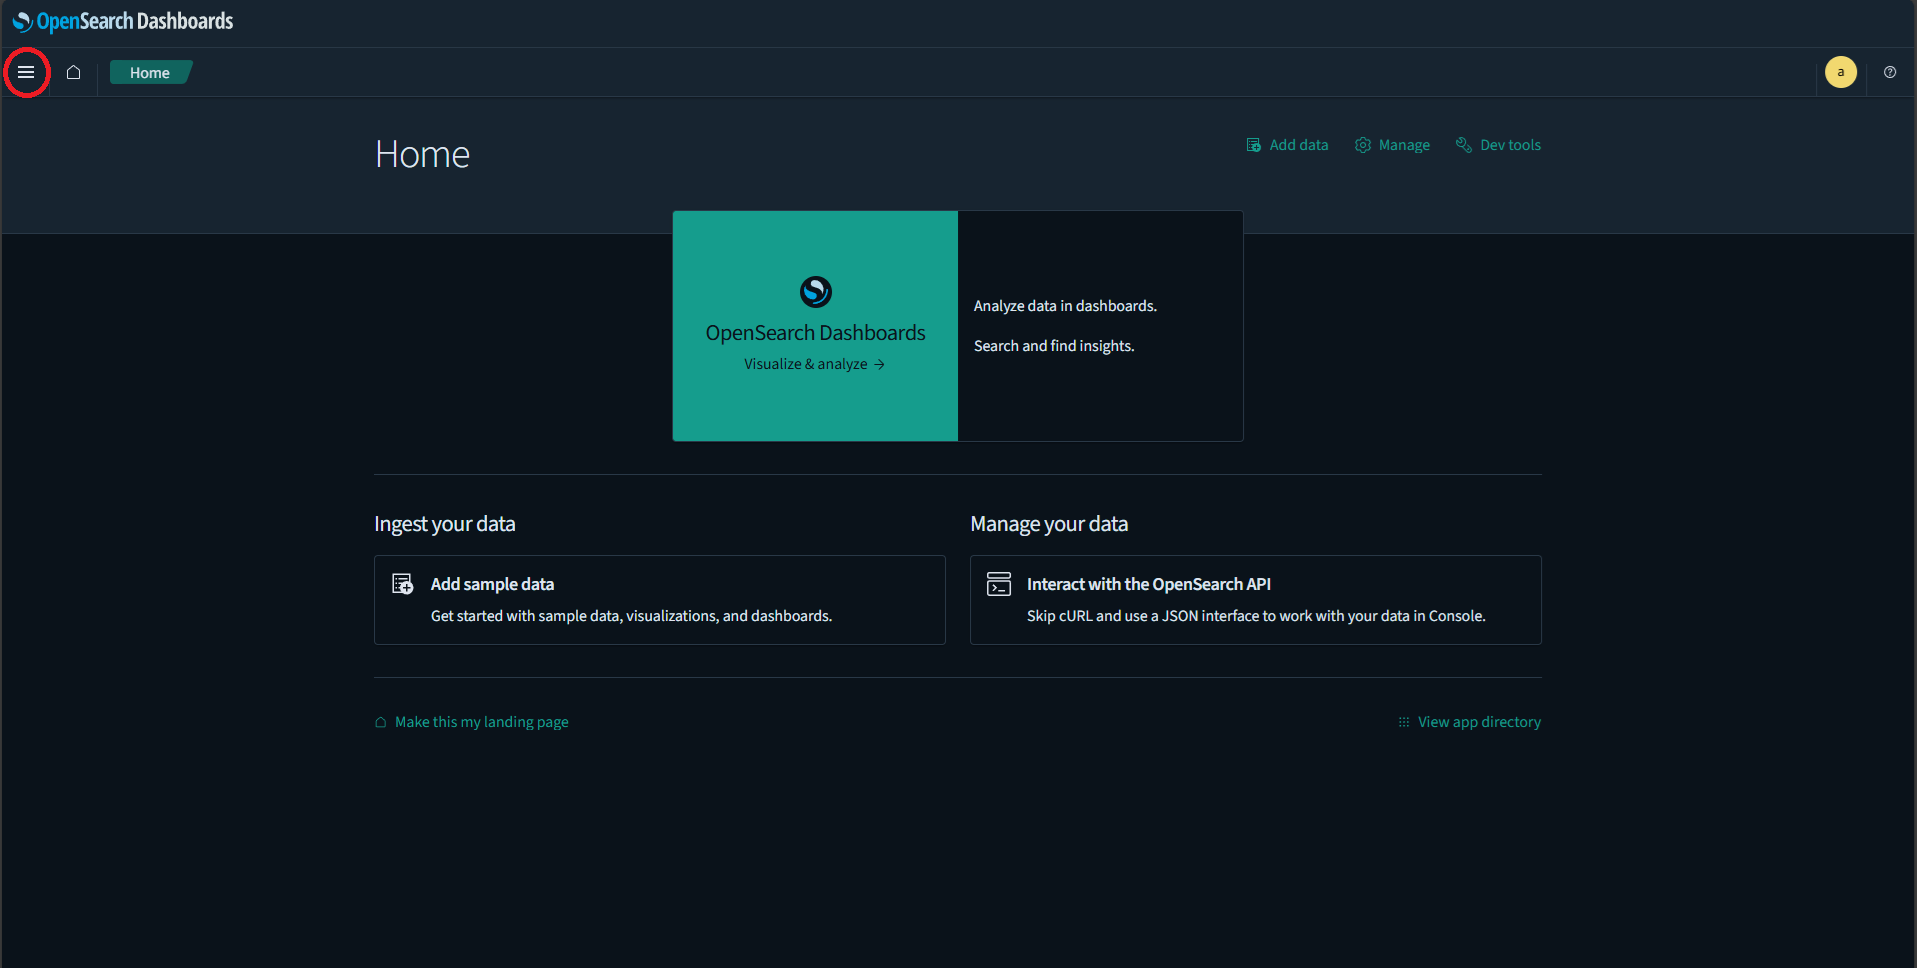
First, you have to open OpenSearch Dashboard page on your browser. You will have to input your credential.

After that, you need to navigate to sidebar and seek for OpenSearch Dashboard's dashboard tile.
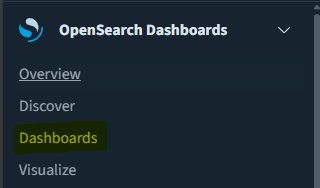
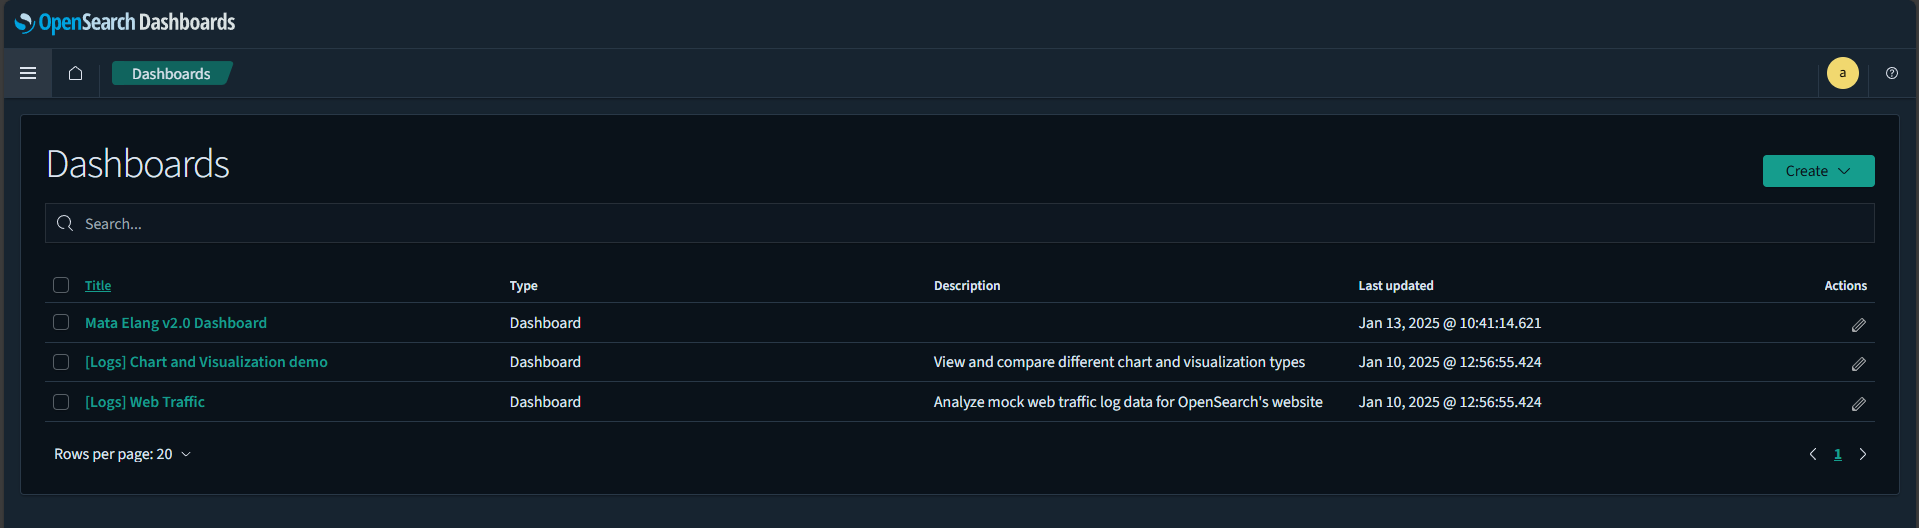
And then, choose which dashboard you want to see.
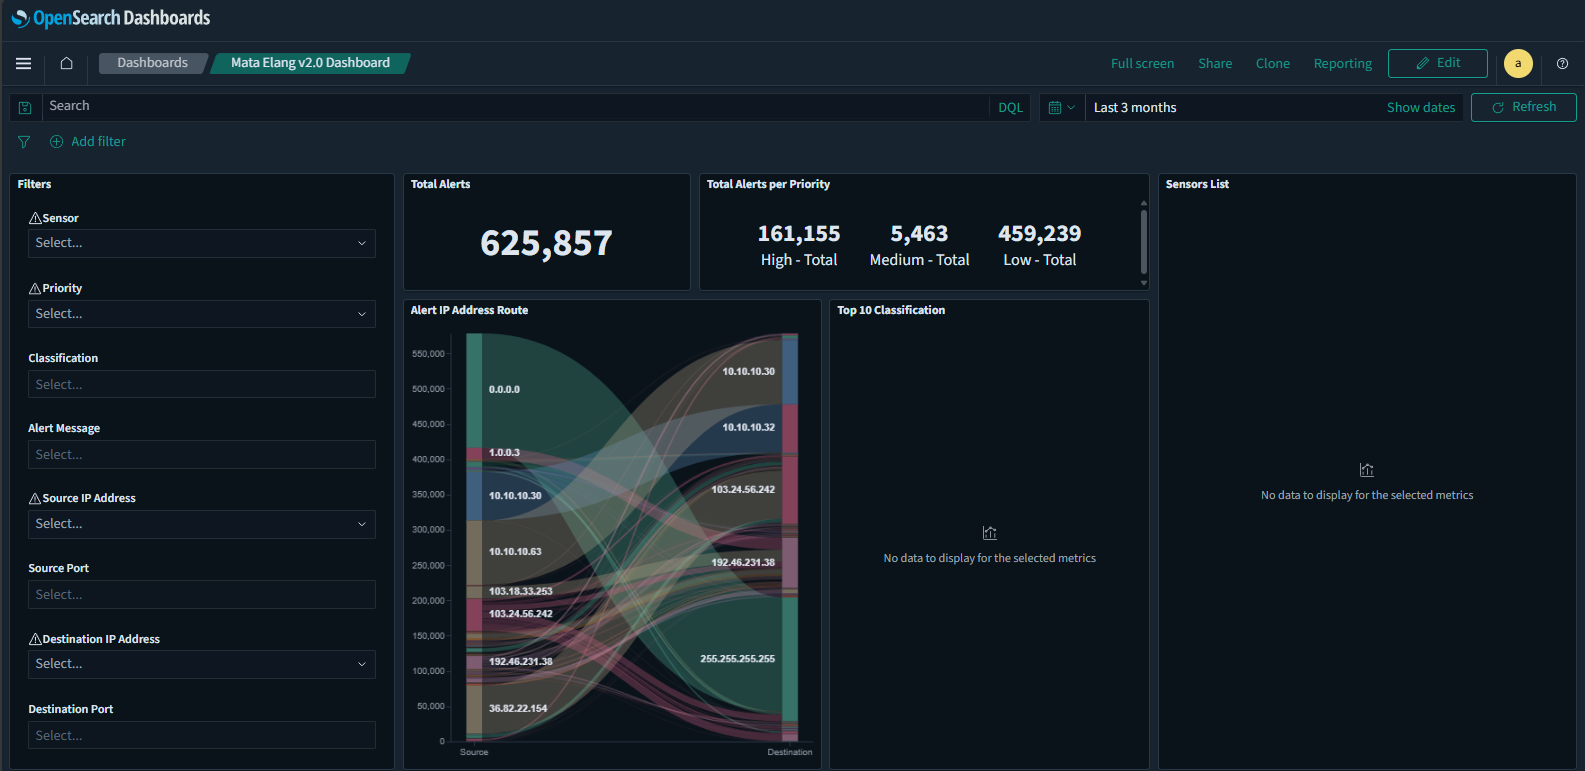
You will have few parts of dashboard's tools, such as charts, filter, and data display. You will see total alerts number, and total alerts per priority number. This number is depends on your filter if it set.
Setting Your Time Filter
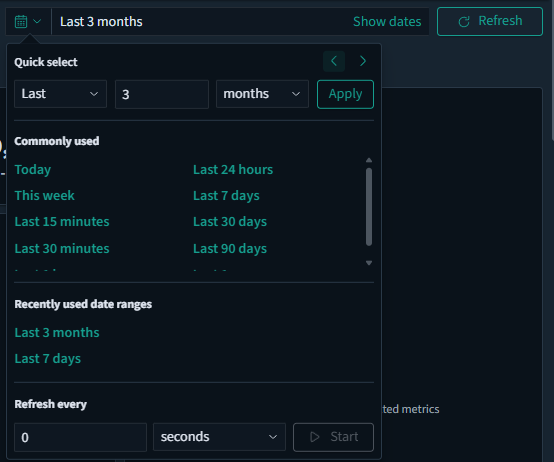
You can adjust the time filter if you want to see more data from past. Set the start date and end date as you want. Press Refresh button after that to refresh the dashboard to show the data based on your time filter.
Setting Your Sensor Filter
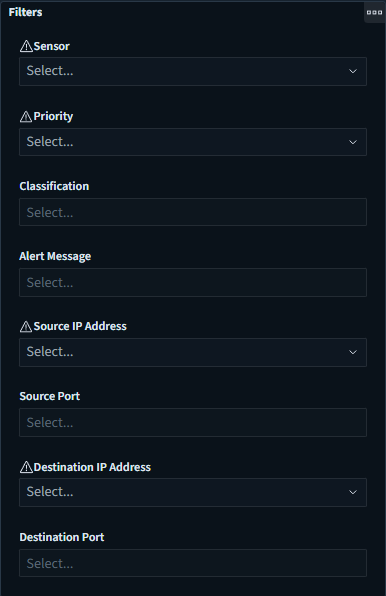
You can adjust the sensor filter if you want to see each alerts detected by each sensor. For instance, You could select a sensor and set the alerts priority, then you could set one and many classification you want to investigate. The data display will eventually shows data based on your sensor's filter.
Alert IP Address Route Chart Reading
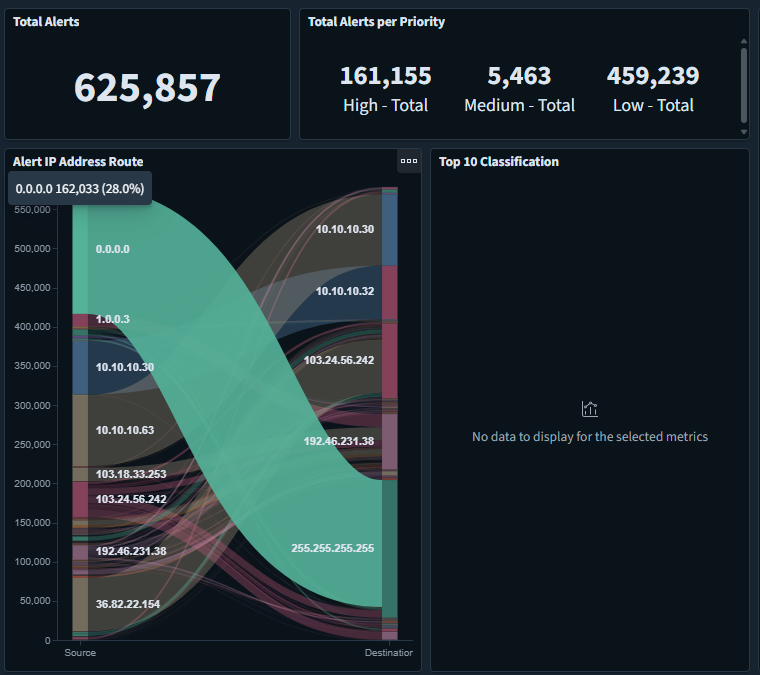
This is an example of Alert IP Address Route chart. To read it, you have to understand that left side of the chart is Source IP Address, where the alerts comes from, and the right side is Destination IP Address, where the alerts is sent to.
Each of streams explaining how many alerts going from an IP Address to target's IP Address. For example, that green stream tells us that there's some alerts, going from 0.0.0.0 to 255.255.255.255 and the total green's alert is 162.033 alerts, which contributing about 28% of total alerts recorded.
Sensor List Table
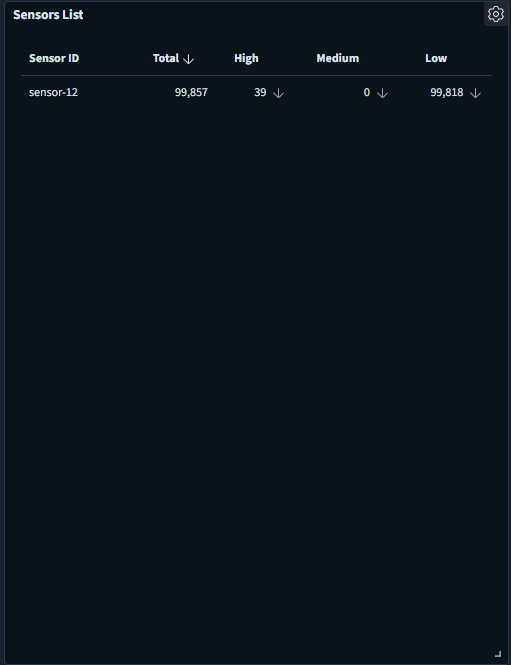
This table provides a detailed overview of the sensors connected to the defense center, specifically focusing on the data collected by each sensor.
Table Overview
- Title: The table is titled "Sensors List," indicating that it lists various sensors monitored by the defense center.
- Columns: Sensor ID: This column identifies each sensor uniquely. In the provided data, there is only one sensor listed with the ID "sensor-12."
- Total: This column shows the total number of events or data points collected by the sensor. For "sensor-12," the total is 99,857.
- High: This column indicates the number of high-priority or high-severity events detected by the sensor. For "sensor-12," there are 39 high-priority events.
- Medium: This column shows the number of medium-priority or medium-severity events. In this case, "sensor-12" has recorded 0 medium-priority events.
- Low: This column represents the number of low-priority or low-severity events. "Sensor-12" has recorded 99,818 low-priority events.
Top 10 Classification with Priority Table Reading
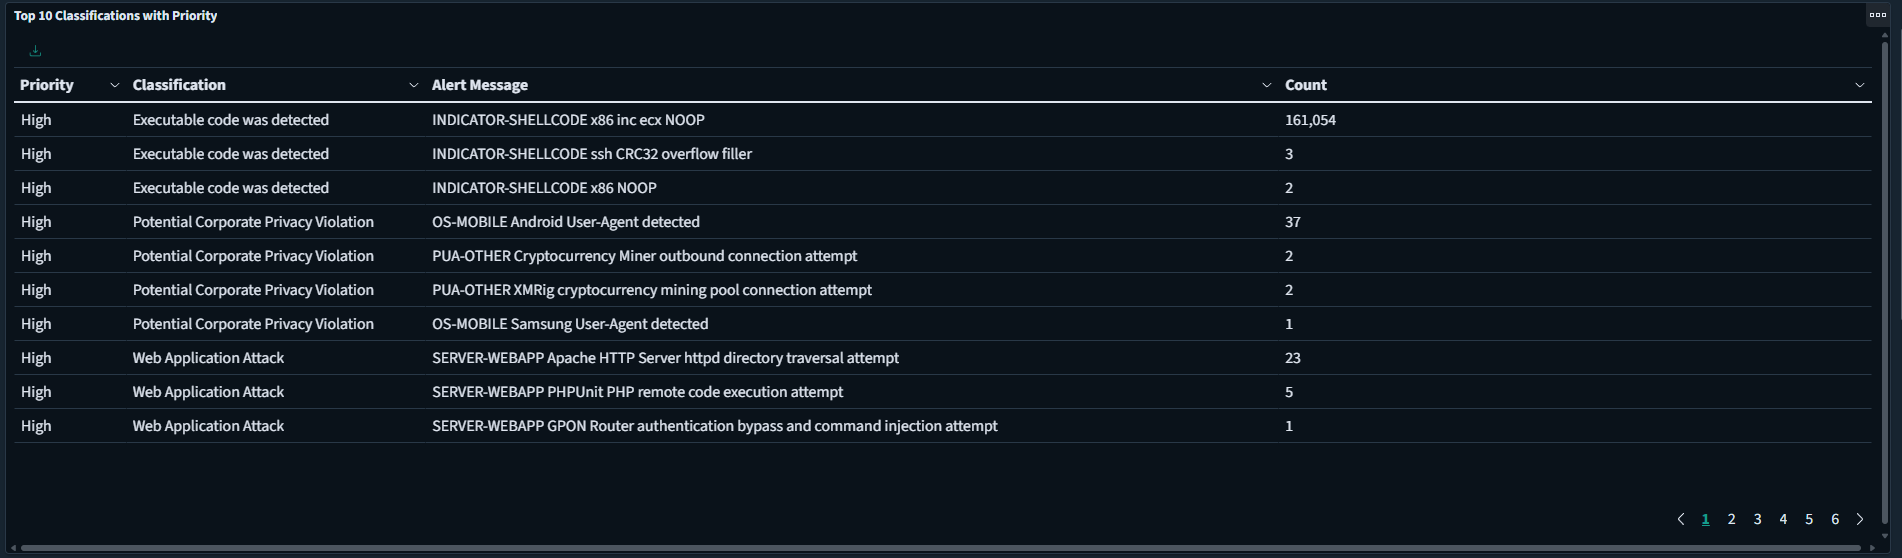
This table inform you of top 10 most malicious alert recorded by classification and priority. For example, the most malicious alert among that list informs you that there was some attempts of code execution with descriptive message and total alert's count.
Alerts by Priority Table Reading
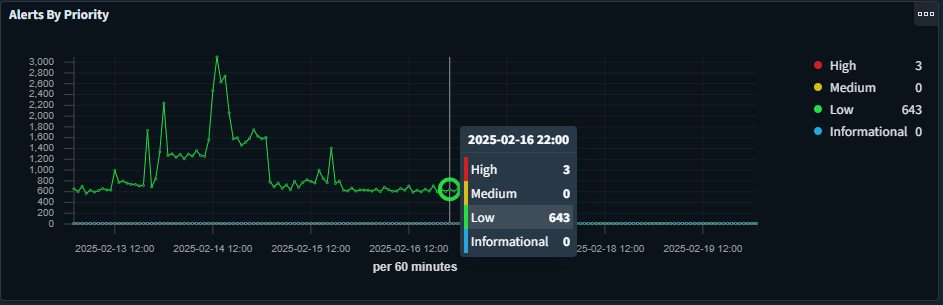
This table informs you about total alerts categorized by priority (explained by color lists on left) that represented as Y - Axis per 60 minutes of time interval represented as X - Axis that visualized as dots.
Alerts by Protocol Table Reading
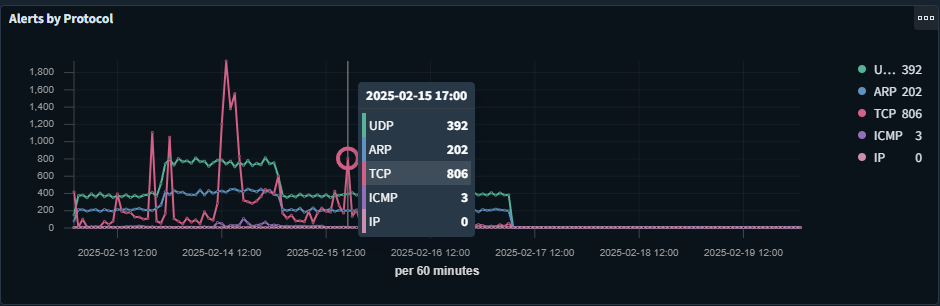
This table informs you about total alerts categorized by protocol (explained by color lists on left) that represented as Y - Axis per 60 minutes of time interval represented as X - Axis that visualized as dots.
Top 10 Source IP Address List Table Reading
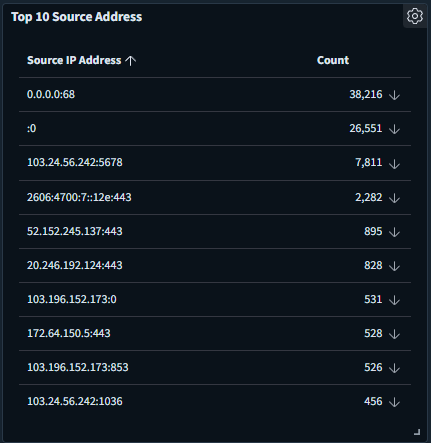
This table informs you about top 10 most frequent source IP Addresses from which network traffic originates, along with the corresponding count of occurrences.
Source IP Address Mapping
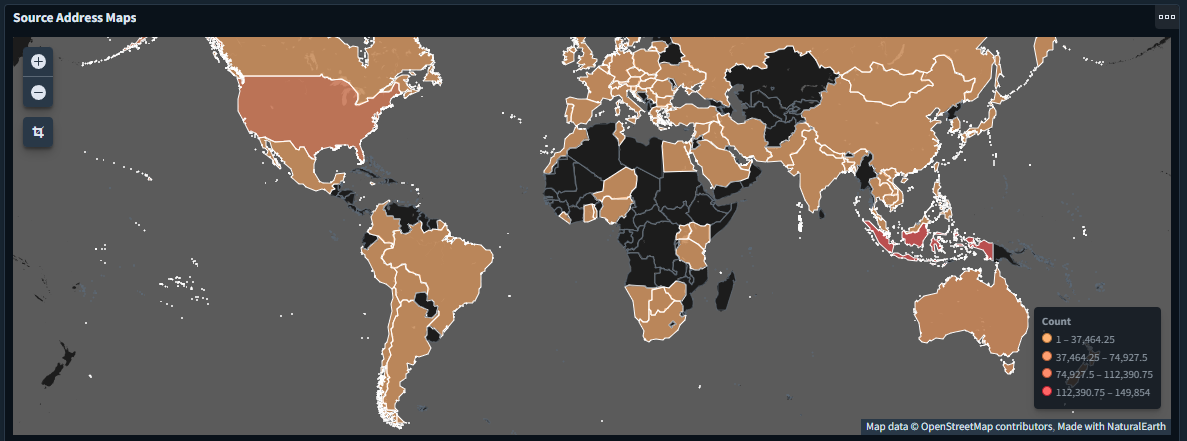
This map informs you about alert's source IP Address location. Each color explains about quantity of alerts sent from that location.
Top 10 Source IP Address Country Table Reading
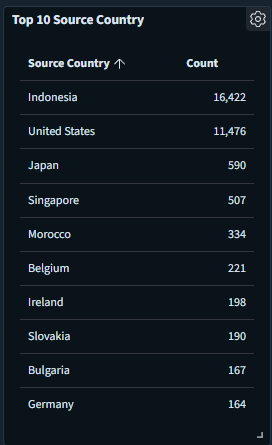
This table informs you about top 10 country from which source IP Addresses originates from, along with the corresponding count of occurrences.
Top 10 Destination IP Address List Table Reading
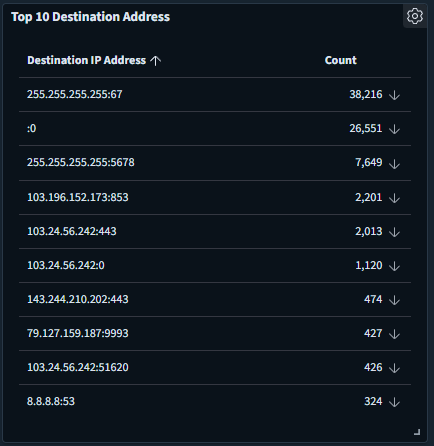
This table informs you about the top 10 most frequent destination IP addresses to which network traffic is directed, along with the corresponding count of occurrences.
Destination IP Address Mapping
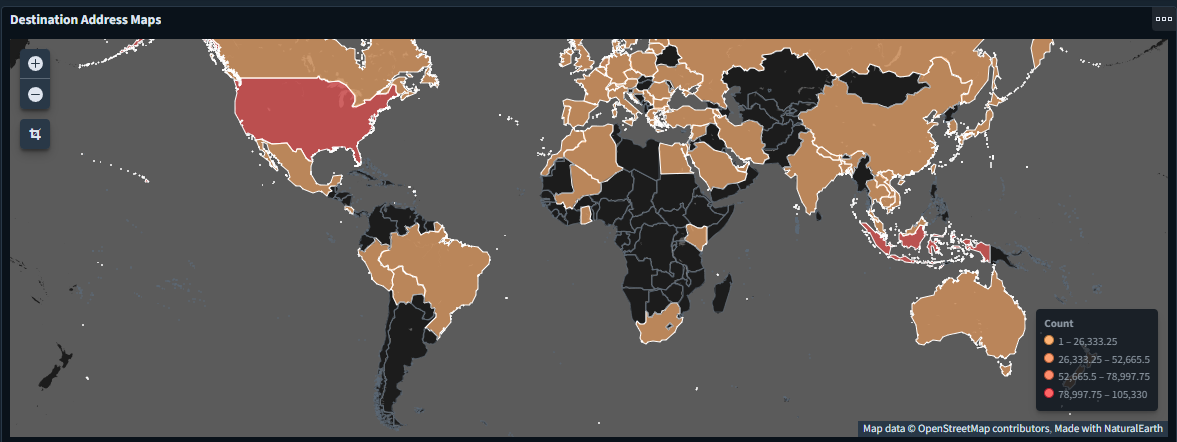
This map informs you about alert's destination IP Address location. Each color explains about quantity of alerts sent to that location.
Top 10 Destination IP Address Country Table Reading
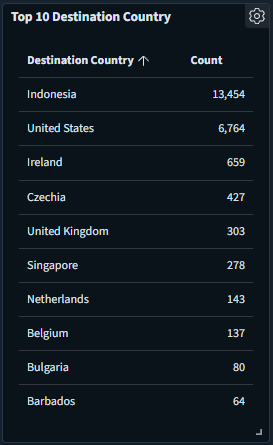
This table informs you about the top 10 destination countries to which IP addresses are directed, along with the corresponding count of occurrences.
Alert Detail
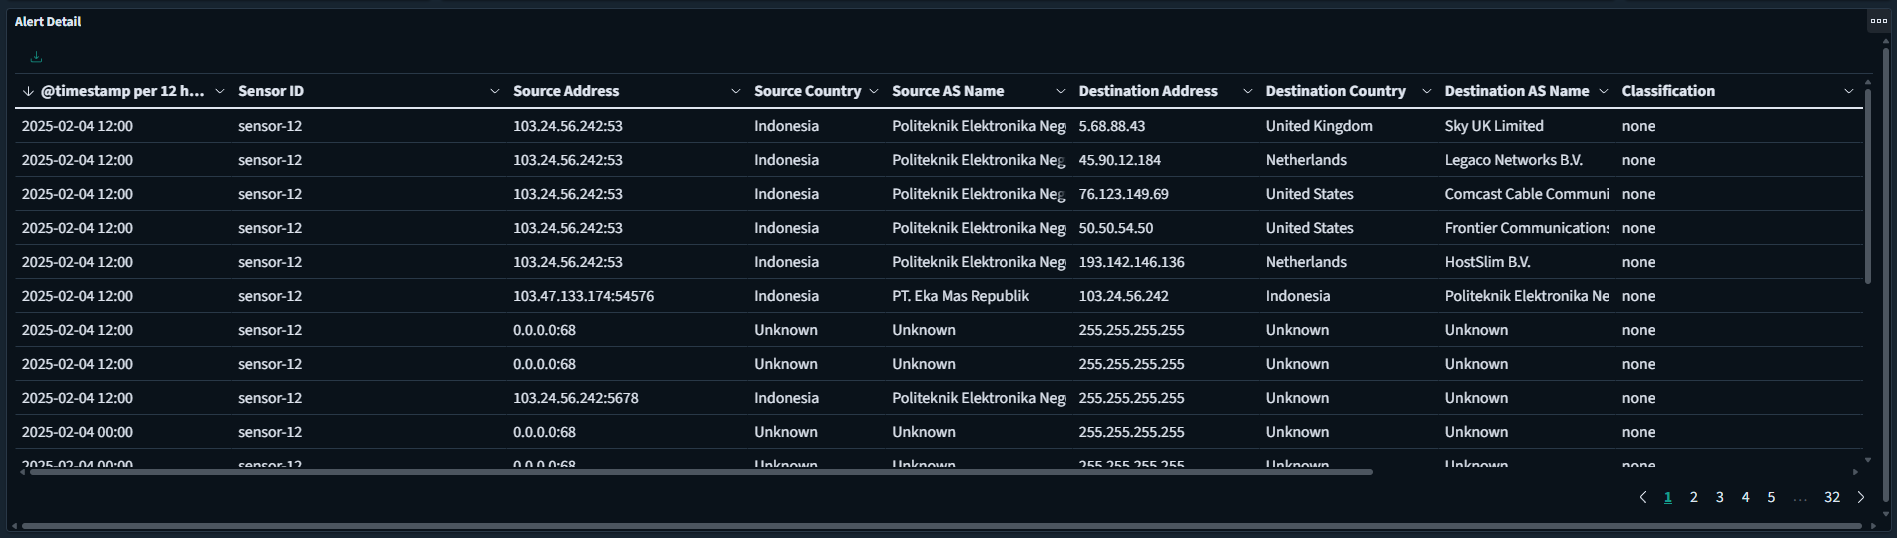
This table informs you about alert's detail. You will see each alert's timestamps, which sensor that detected it, alert's source IP Address, alert's source IP Address country, alert's source alias, alert's destination IP Address, alert's destination IP Address country, alert's destination alias, and alert's classification.